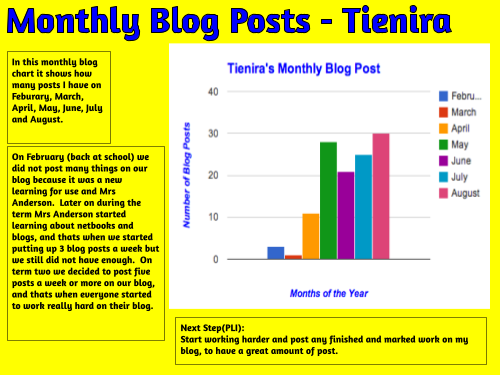
HEre is a poster that I have made on how many blog posts I have each month this year and how I have improved that. This graph was created on spreedsheet and before we did the graph we wrote the name of the months from Feburary to August, and then wrote the number of posts I have on each month. Then you highlight everything on the spreedsheet and click on the chart sign at the top. THen you make your own chart.
No comments:
Post a Comment
Note: only a member of this blog may post a comment.